

Most QR Code campaigns launch with excitement. They get printed on flyers, menus, posters, or packaging and are then left to run on autopilot. Many businesses assume the job is done if a QR Code is scanned.
But that’s where opportunities are lost. While you stay static, competitors experiment with colors, placements, and messaging, finding out what works best. If you treat your QR Codes like static billboards, you’ll never discover these wins.
That’s why A/B testing QR Codes is no longer optional. It’s the key to turning QR Codes into measurable, high-performing marketing assets.
QR Codes are unique: they live in the physical world but drive digital actions. Unlike online ads, you aren’t limited to just clicking a button to run tests. Instead, QR Codes open up creative ways to experiment, whether through placement, design, or messaging.
With the correct tracking setup and a bit more runway, you can capture richer insights that connect offline touchpoints to online results. This guide covers all you need to know about creating, testing, and tracking the best A/B strategies for QR Codes.
Table of contents
- What is A/B testing for QR Codes?
- Variables you can A/B test in QR Codes and how they boost results
- How to run your first QR Code A/B test with TQRCG
- The 5D framework of best practices for QR Code A/B Testing
- Optimize every scan with smarter A/B testing
- Frequently asked questions
What is A/B testing for QR Codes?
A/B testing for QR Codes means experimenting with different designs, placements, or settings to see what drives more scans and conversions. Just like with emails or landing pages, you compare two or more versions, but here, the focus is on how people interact with QR Codes in the real world.
For example, imagine a coffee shop running two tests:
- Version A: A QR Code linking to a PDF menu during the morning rush.
- Version B: A QR Code linking to the loyalty signup page in the afternoon.
After two weeks, the shop compares engagement and revenue to decide which performs better.
In theory, QR Code A/B testing is similar to digital experiments. However, running tests requires a different approach because QR Codes are printed and used in physical spaces.
How does QR Code A/B testing differ from digital ad testing?
Digital ad A/B tests happen in controlled online environments. You can instantly split traffic, tweak a button, or update messaging and get results fast. But QR Code testing faces unique challenges:
- You can’t show multiple QR Code variants to the same audience simultaneously. Instead, you test by location, time period, or printed material.
- Tracking must connect the physical scan to the digital action, from scan to conversion.
- Physical QR Codes take longer to reach statistical significance than digital ads, often requiring days or weeks.
Even with these constraints, A/B testing for QR Codes shouldn’t be skipped. You can play around with many variables to achieve results that may exceed your expectations.
Variables you can A/B test in QR Codes and how they boost results
A/B testing QR Codes removes the guesswork around how you can improve campaign performance. Instead of relying on assumptions about what should work, you gather real-world data showing which designs, placements, and messages drive the most scans and meaningful engagement for your audience.
Here are all the variables that you can A/B test with QR Codes:

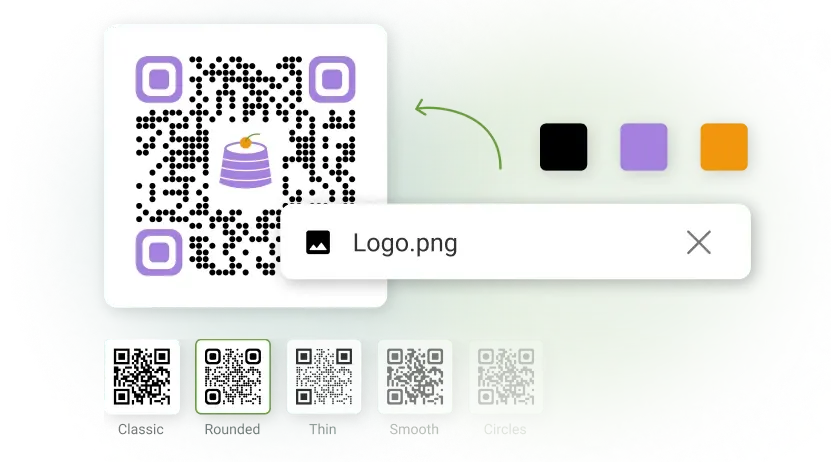
1. Visual design
Your QR Code’s appearance has a direct impact on whether someone notices it, trusts it, and scans it.
- Colors: Testing warm vs. cool tones often reveals surprising differences. In restaurants, warm reds and oranges may trigger more appetite-driven engagement, while finance brands may see higher trust with deep blues and greens.
- Brand integration: Adding your logo to the QR Code can build trust, but too much branding can hurt scanability. You could test this by creating three QR Code versions (large logo, small logo, and no logo) and then comparing scan rates to see if branding builds trust or reduces scanability.
- Contrast and framing: High-contrast designs tend to scan faster in varied lighting, but not all contexts need black-and-white. Test QR Codes with high contrast, different background colors, and borders to see which gets you the highest scans.
2. Size and placement
Where and how big your QR Code is can matter more than how it looks.
- Size testing: Small QR Codes risk frustrating users if they can’t scan from a natural distance; overly large ones waste space. Test for your audience’s typical viewing distance and environment.
- Height and angle: Eye-level isn’t always best. Counter-height QR Codes may work better in retail as customers look down at products. Placement on angled or curved surfaces must be tested for approachability.
- Surrounding space: Testing different amounts of white space around your QR Code can reveal the ideal balance between visibility and design harmony. Too little space can interfere with scanning accuracy, while too much may waste valuable layout real estate.
3. Call-to-action messaging
What you say around your QR Code is often as important as the code itself.
- Benefit-focused language: Test specific, outcome-driven CTAs such as “Get Your Discount Code” against generic “Scan for More Info.”
- Urgency: If your audience responds to urgency, time-limited offers (“Scan in the next 24 hours for 20% off”) can trigger immediate action.
- Clarity vs. creativity: Clever wordplay may suit certain campaigns, but plain language that tells users exactly what they’ll get usually wins.
4. Static vs. dynamic QR Codes
The type of QR Code you use changes what and how you can test.
Static QR Codes are fixed. Every variation means a reprint. That’s fine for one-off uses, but not ideal for campaigns that need agility.
Dynamic QR Codes let you update destinations, rotate creatives, and track performance without replacing the printed QR Code, making them a must-have for ongoing A/B testing.
💡 Pro Tip: Why you must always opt for dynamic QR Codes
- A/B test campaigns even without reprinting QR Codes.
- Run time-sensitive campaigns or present different campaigns at different locations.
- Track scans by time, location, and device for deeper insights.
Start testing smarter today! Sign up to create a dynamic QR Code
5. Landing page experience
The journey doesn’t stop after the scan. Your A/B testing must include the destination as well.
- Mobile-first design: Nearly all scans happen on mobile. Consider the destination a QR Code leads to by testing different layouts, load times, and navigation styles.
- Context relevance: Match content to where the QR Code is placed. For example, a QR Code in a restaurant must lead to an easy-to-browse mobile menu, not a desktop site.
- Conversion flow: Test shorter, action-focused landing pages against detailed ones to see which drives higher completions.
6. QR Code file format
The QR Code file format you choose when exporting your QR Code directly affects scannability and print quality, a detail often overlooked in A/B testing.
- PNG/JPG (raster format): These are fine for digital use, such as social media or email, but they can lose clarity when resized for large posters or banners. Test raster formats for small-scale campaigns vs. large prints.
- SVG (vector format): Scales infinitely without losing sharpness. SVG files ensure crisp edges even on billboards or window decals.
- Environmental durability: Printed QR Codes may fade, pixelate, or blur depending on the format. Testing formats side by side (SVG print vs. PNG print) helps uncover which maintains readability in different lighting or weather conditions and can reveal whether format alone impacts campaign success.
How to run your first QR Code A/B test with TQRCG
If you’ve never run a QR Code A/B test before, think of it like running a small but focused marketing campaign. The QR Code Generator (TQRCG) lets you plan, create, launch, measure, and optimize your A/B test campaigns. Here are the steps you need to follow:
Step 1: Define your campaign goal and hypothesis
Before you even create a QR Code, decide what success looks like.
- Pick one clear primary goal, such as:
- Increase scan rates on flyers
- Boost website sign-ups from in-store posters
- Drive more menu views via table tent QR Codes for restaurants
- Form your hypothesis. This can be a simple “I believe…” statement.
- “I believe using a branded QR Code will increase scans because it stands out and builds trust.”
- “I believe changing the call-to-action from ‘Scan Here’ to ‘Unlock Your Offer’ will boost engagement.”
Step 2: Choose the variable to test
Good A/B testing means changing just one thing at a time so you can pinpoint what worked.
Possible test variables:
- QR Code design (color, frame style, or logo)
- Call-to-action text
- Placement on the material (top vs. bottom)
- Size of the QR Code
- Background contrast
- QR Code format (such as SVG, PNG, etc.) for scanability
Step 3: Create two QR Code variants in TQRCG
Now you’ll build your control and your test version.
- Create the control: Your baseline QR Code (current design or approach).
- Create the variant: Change just the one variable you’re testing.

- Use dynamic QR Codes: To update the destination later without reprinting.
- Add UTM parameters to your QR Codes: To track each version separately.

💡 Pro tip: Use TQRCG’s QR Code Generator to manage multiple QR Codes in an organized dashboard . You can create visually distinct versions while keeping the same destination URL, or keep the design constant while testing various landing page URLs (with dynamic QR Codes). Save each version in your TQRCG dashboard with clear labels like “Flyer Test – Version A” and “Flyer Test – Version B” so you don’t mix them up.
Step 4: Deploy in controlled conditions
Physical QR Code campaigns can get messy if you don’t control where and when you place them.
- Test in identical locations simultaneously (e.g., two branches of your store).
- Or, run them in the same location but at different times (e.g., Week 1 = Version A, Week 2 = Version B).
- Keep audience type, lighting, and placement consistent to avoid noise in your results. This will limit variability and ensure you get the right results from your A/B tests.
Step 5: Track and monitor results
This is where The QR Code Generator’s dynamic QR Codes make your life easier.
- Track scan counts to see which version gets more attention.
- Monitor location data if available to ensure scans come from your intended audience.
- Check conversion metrics such as sign-ups, orders, and downloads to understand what happens after the scan.

💡Pro tip: Use TQRCG’s built-in analytics dashboard to compare your two versions without exporting data.
Step 6: Set the test duration and sample size
Rushing an A/B test can lead to false wins.
- Run the campaign long enough to gather a meaningful number of scans (hundreds, not just a few).
- Account for seasonality. The results might be skewed if you’re testing during a holiday week.
- Decide in advance when you’ll stop the test and call a winner.
💡Pro tip: Record your start and end dates inside your campaign notes in TQRCG so you don’t forget.
Step 7: Analyze and apply your findings
Once you have enough data:
- Compare both versions in your TQRCG analytics dashboard.
- Declare a winner based on your chosen goal. Not just more scans, but which drove the better business outcome.
- Apply the winning version to your future campaigns and keep testing new ideas.
Running a QR Code A/B test isn’t just a try-it-and-see exercise. It’s a structured campaign that, when done right with TQRCG, tells you exactly how to get more scans, conversions, and impact from every QR Code you create.
The 5D framework of best practices for QR Code A/B Testing
After your first A/B test campaign goes live, you ideally want the next one to be more successful.
The 5D Framework of best practices keeps you focused on what matters: testing with discipline, securing destinations, measuring depth of engagement, controlling environments, and validating results with data that holds up.
1. Discipline: Align iteration with campaign cycles
Run small, controlled changes, measure, adjust, and retest. Each winning variant becomes your new baseline. Factor in seasonality and campaign goals because holiday shoppers, event audiences, or B2B buyers behave differently. Use past campaign data to guide what you test first so your iterations stay relevant.
2. Destination: Lock down your QR Code links
Always use HTTPS destinations, validate links before launch, and monitor for broken or malicious redirects. QR Codes under test should only lead to stable, trusted pages. One unsafe redirect can damage trust and invalidate your results.
3. Depth: Track engagement beyond the scan
Scans alone don’t prove value. Measure:
- Landing success rates (do scans actually load the page?)
- Engagement depth (time on site, pages viewed, video plays, downloads)
- Funnel completion (form fills, purchases, shares)
Use GA4, Mixpanel, or your QR Code platform’s analytics to capture micro-conversions and reveal which test variant drives meaningful outcomes.
4. Domain Control: Keep test environments clean
Distribute flyers in equal-traffic areas, rotate packaging evenly across stores, or split digital audiences by segments. Document the setup before launch to separate true performance from outside noise.
5. Data Validation: Wait for results that hold up
Never call winners on early spikes. Trust results only once they’re statistically significant and repeatable across time or audience segments. Look for sustained improvements in scan-to-landing rates, conversion percentages, and funnel completion.
Optimize every scan with smarter A/B testing
A/B testing helps you see which QR Code designs, placements, and messages truly resonate with your audience. But the real advantage comes when you have the right tools to test, track, and iterate quickly.
With The QR Code Generator, you can:
- Create dynamic QR Codes that let you change destinations without reprinting
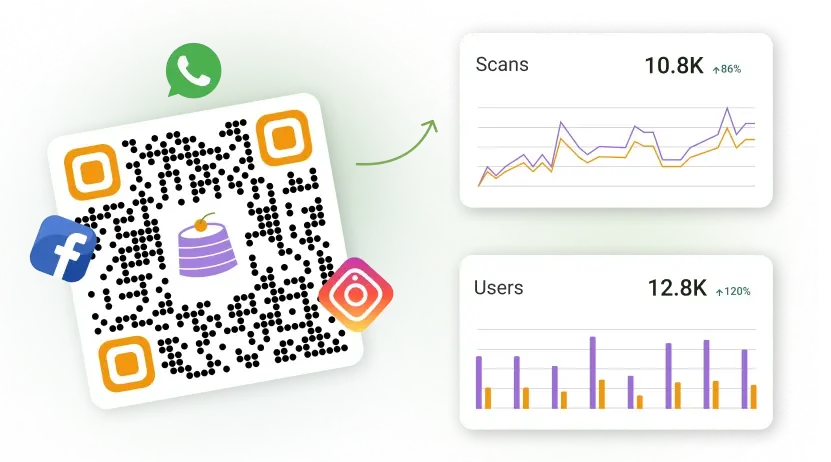
- Access real-time analytics on scans by time, location, and device type
- Run design variations (color, logo, size, quiet zone) to see what drives more scans
- Compare engagement and conversions across different landing pages
- Manage multiple campaigns from one clean dashboard
Whether you’re testing restaurant menus, retail promotions, or marketing flyers, TQRCG gives you the flexibility and insights to refine your strategy continuously.
Sign up for The QR Code Generator today and start running smarter A/B tests that turn scans into measurable ROI.
Frequently asked questions
Start with digital mockups or a small-batch print run before rolling out at scale. This way, you can test designs, CTAs, and placements without committing to a large print cost.
Use dynamic QR Codes with unique URLs or UTM parameters for each variant. This allows real-time scan tracking without reprinting new codes. Sign up to The QR Code Generator to create a free trackable QR Code.
Your QR Code campaign must be long enough to gather statistically significant results. For most campaigns, that’s between 1 and 4 weeks, depending on scan volume.
No, it is not. While scan rates measure visibility and engagement, conversions reveal actual ROI. Always track post-scan actions such as sign-ups or purchases.
Yes, but you’ll need separate static QR Codes for each variant and distinct landing pages or tracking links to measure results. A/B testing is just more convenient and effective with dynamic QR Codes.